 Scribba
Some lab data refuses to fit on ordinary graph paper. Bacteria counts go from hundreds to hundreds of thousands. A radioactive sample's activity drops so fast that the interesting tail gets squashed against the axis. Plot it on a normal grid and you get a curve hugging one corner, which tells you almost nothing.
Log paper fixes that by spacing the axis by multiplication instead of addition. Used well, it turns curves into straight lines, and a straight line is something you can measure. This guide explains which kind of log paper to use, how to plot on it, and how to read a growth rate or exponent off the result.
How a log scale works
On a normal axis, equal distances mean equal differences: 1 to 2 is the same distance as 2 to 3. On a log axis, equal distances mean equal ratios: 1 to 10 is the same distance as 10 to 100 and 100 to 1,000.
Each of those stretches is called a cycle (or decade). Inside a cycle, the lines bunch up toward the top, because the gap from 1 to 2 is a doubling while the gap from 9 to 10 is a small step.
Two consequences that matter for plotting:
- You choose what each cycle starts at. The first cycle can be 1 to 10, or 0.01 to 0.1, or 1,000 to 10,000. Label the start of each cycle with a power of ten that fits your data.
- There's no zero. A log axis never reaches zero and can't show negative numbers. If your data includes zeros, they can't go on a log axis.
Semi-log or log-log?
The choice depends on the relationship you expect.
- Semi-log paper has one log axis and one ordinary axis. Use it for exponential relationships, y = A·bˣ, where something multiplies by the same factor in each equal step of time. Exponential growth and decay plot as straight lines.
- Log-log paper has log scales on both axes. Use it for power laws, y = a·xⁿ, where y depends on a power of x. Power laws plot as straight lines with slope n.
Common examples:
- Semi-log: bacterial growth in the log phase, radioactive decay, capacitor discharge in an RC circuit, first-order reactions, and drug clearance from the body.
- Log-log: a pendulum's period against its length, a planet's orbital period against its distance from the sun, light intensity against distance, and many scaling relationships in biology and physics.
Tip: if you don't know which model fits, plot your data on both. Whichever paper turns it into a straight line tells you the relationship. If neither does, the data isn't a simple exponential or power law.
How to plot points on a log axis
- Find your range and pick the power of ten that starts the first cycle, just below your smallest value.
- Label every cycle start (1, 10, 100 or whatever fits). Label a few in-between lines too, like 2 and 5, so plotting is quicker.
- Place each point by decade first, then position. For 350, find the 100 to 1,000 cycle, then the line for 3 within it, then go a bit past halfway to the 4 line.
- Use landmarks. Within any cycle, the 2 line sits a little under a third of the way up, 3 sits a little under halfway, and 5 sits about seven tenths of the way.
- Draw a straight line of best fit, not a curve through every point.
Reading results off the line
The payoff of a straight line is that you can measure it. Always pick two points on your best-fit line, as far apart as possible, not two of your data points.
- Growth or decay rate (semi-log). For y = A·eᵏˣ, the rate is k = ln(y₂ / y₁) ÷ (x₂ − x₁). It's negative for decay.
- Half-life or doubling time (semi-log). On a log axis, halving is always the same vertical distance. Find where the line reaches half any value you like, and read the time difference. Doubling time works the same way going up.
- Exponent (log-log). For y = a·xⁿ, the slope is n = log(y₂ / y₁) ÷ log(x₂ / x₁). Use the same log base on top and bottom.
Check your exponent against theory when you can. A pendulum's period should come out near a slope of 1/2, a planet's orbital period against distance near 3/2, and light intensity against distance near −2. If your number is close, your data and your method both look right. If it's far off, look for a units mix-up or a mislabeled cycle.
One common catch: for cooling, plot the difference between the object's temperature and the room's temperature on the log axis, not the temperature itself. That difference is what decays exponentially.
Semi-log and log-log paper in Scribba
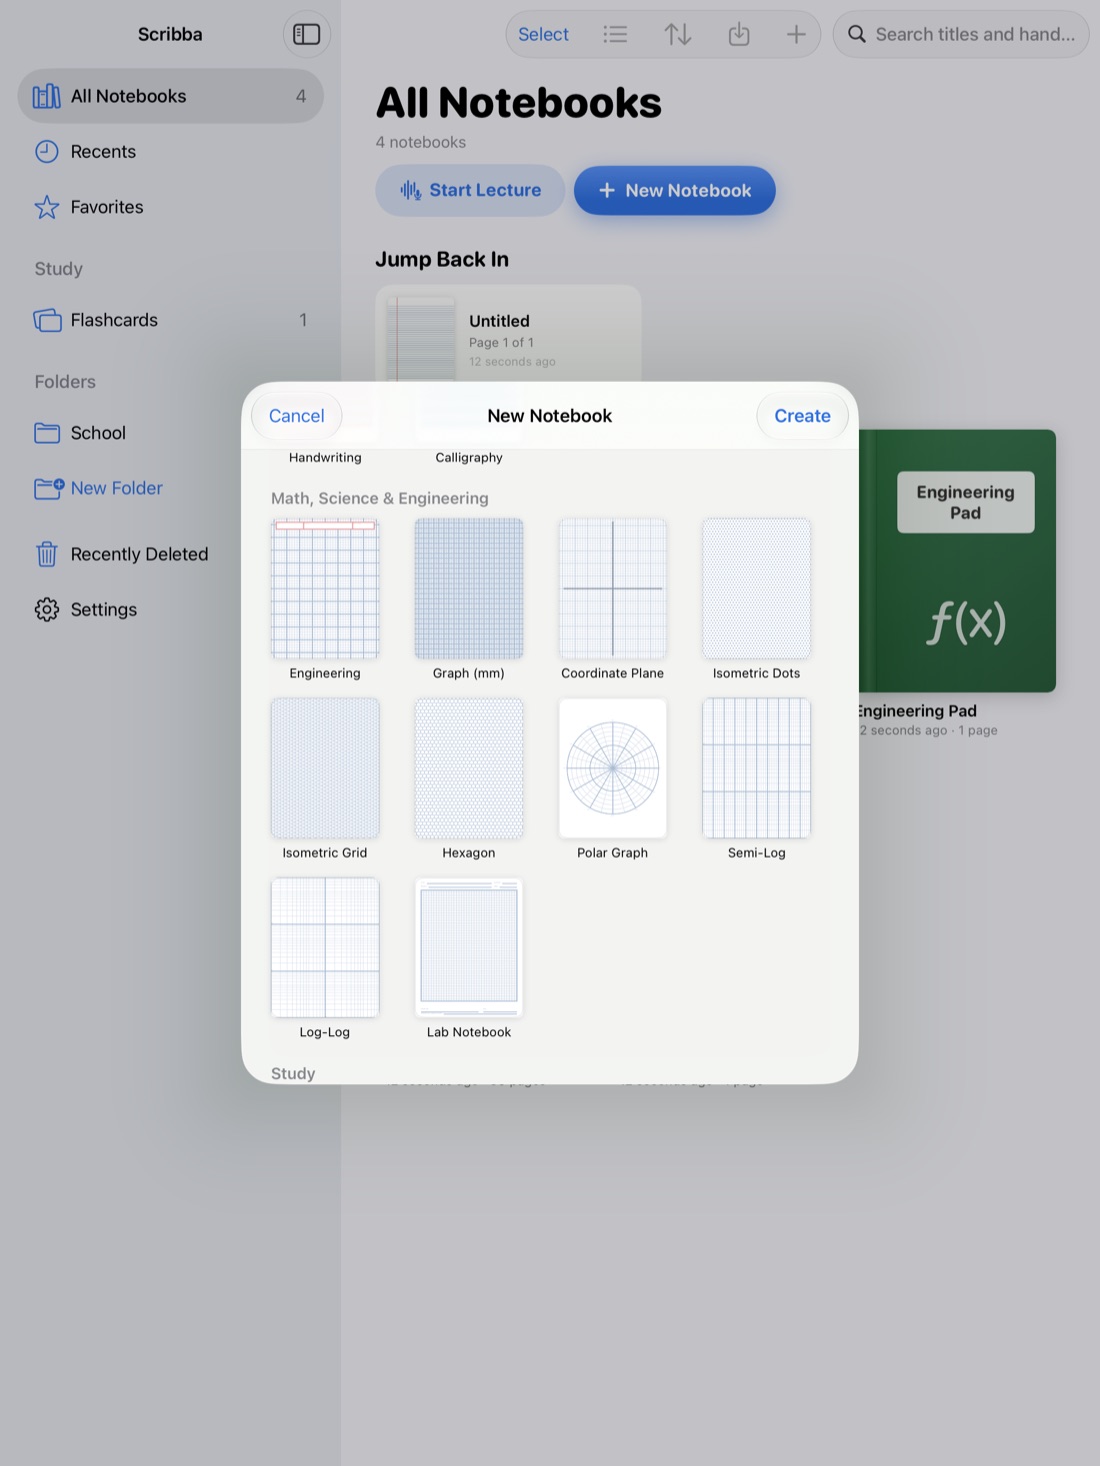
Scribba has both in the Math, Science & Engineering section of the paper picker. Semi-Log has a log scale on one axis with 3 cycles, so it covers a range of a factor of 1,000. Log-Log has log scales on both axes. Like Scribba's other graph papers, both run edge to edge.
Setting up a lab graph:
- Put the graph next to the data. Paper type is set per page from the page sidebar, so your data table can sit on a lab notebook or graph paper page with the log plot on the very next page.
- Draw the best-fit line straight. Hold the Apple Pencil still at the end of a stroke and it snaps into a straight line. The ruler helps when you want to line it up with care.
- Label cycles neatly. The Zoom Window lets you write powers of ten big in a magnified strip, and they land small next to the right line.
- Compare data sets. Use a different pen color for each trial on the same axes.
- Hand it in. Export the notebook or selected pages as a PDF for your lab report.
If your data spans more than three cycles on semi-log paper, take the log of each value yourself and plot those numbers on ordinary graph paper. The straight-line test and the slope work the same way. For more on lab classes, see math and chemistry notes on iPad and physics notes on iPad.
Frequently asked questions
What's the difference between semi-log and log-log paper?
Semi-log has one log axis and turns exponential relationships into straight lines. Log-log has two log axes and turns power laws into straight lines.
Why can't I plot zero on log paper?
A log scale is spaced by ratios, so it gets closer and closer to zero without ever reaching it. Zero and negative values have no place on a log axis.
Can Scribba calculate the best-fit line or slope for me?
No. Scribba doesn't do math or recognize equations. You draw the line and read the values yourself, which is what most lab courses ask you to show.