 Scribba
"Graph paper" covers two different tools. One is a plain grid of squares, which is mostly about lining things up. The other is millimeter graph paper, with heavier lines every few squares, which is about measuring. They look alike, but they're good at different jobs, and picking the right one makes your work faster and easier to read.
This guide covers when to use each, how to plot data by hand so it actually looks like a graph, and how to draw something to scale. At the end, there's how it works in Scribba.
Grid and graph paper do different jobs
A plain grid gives every square the same weight. That's ideal when you care about position, not distance: this number goes under that number, this box sits next to that box. Your eye doesn't need to count anything.
A millimeter graph grid adds a hierarchy. Thin lines mark the small units, and bolder lines mark every 5 and every 10 of them. That makes counting quick. You can find "23 units across" without touching each square, which is exactly what plotting and scale drawing need.
A simple rule: if you'll never count squares, use a grid. If you will, use graph paper.
When plain grid is the better page
Grid paper is the everyday workhorse for anything that needs alignment:
- Arithmetic and algebra. One digit per square keeps columns straight in long division, multiplication and polynomial division, which cuts down on careless errors.
- Matrices and systems of equations. Rows and columns stay lined up, so row operations are easy to follow.
- Tables. Truth tables, data tables and comparison charts come out tidy with no ruler.
- Rough diagrams. Free-body diagrams, circuit sketches and flowcharts look cleaner when boxes sit on grid lines.
- Code tracing. Variable tables for tracing a loop by hand fit naturally into squares.
If a page is mostly writing with a few diagrams, a lighter option like dot grid gives you structure with less clutter.
When you want millimeter graph paper
Reach for graph paper whenever the distances on the page mean something:
- Plotting lab data, like a titration curve, a cooling curve or position against time.
- Histograms and bar charts where bar heights need to be read back accurately.
- Scale drawings, like a floor plan, a part sketch or a map.
- Reading values off a graph, such as interpolating a value between two data points.
How to plot data by hand
A good hand-drawn graph follows the same steps every time. It's worth getting into the habit, because lab instructors often grade the graph itself.
- Decide which variable goes where. The one you controlled or changed (the independent variable) goes on the horizontal axis. The one you measured goes on the vertical axis.
- Find the range of each variable. Note the smallest and largest values so you know how much space you need.
- Choose a scale that uses most of the page. A graph squeezed into one corner is hard to read. Pick steps that are easy to count, like 1, 2 or 5 units per bold square. Avoid awkward steps like 3 or 7, which make plotting slow and error-prone.
- Label both axes with a name and unit, like "Time (s)" or "Temperature (°C)," and mark values at the bold lines.
- Plot each point small and precise. A small cross or a dot with a circle around it is easier to place exactly than a big blob.
- Draw a line or curve of best fit. Don't connect the dots like a puzzle. Real data has scatter, and the trend is what matters.
- Give the graph a title that says what was measured against what.
Tip: if you're plotting two data sets on the same axes, use a different pen color for each and add a small key in an empty corner.
Drawing to scale
Scale drawings come up in physics, engineering, architecture and design classes. The process is simple:
- Measure or list the real dimensions.
- Pick a scale, like 1 bold square = 1 meter, so the whole object fits on the page with some margin.
- Write the scale on the page where you'll see it later.
- Count squares along the bold lines to place each corner, then connect them.
One thing to keep in mind on any screen: the squares are units on the page, not physical millimeters under your Pencil. Zooming in or out changes how big they look. What matters for a scale drawing is the ratio you chose, so always write it down.
Grid and graph paper in Scribba
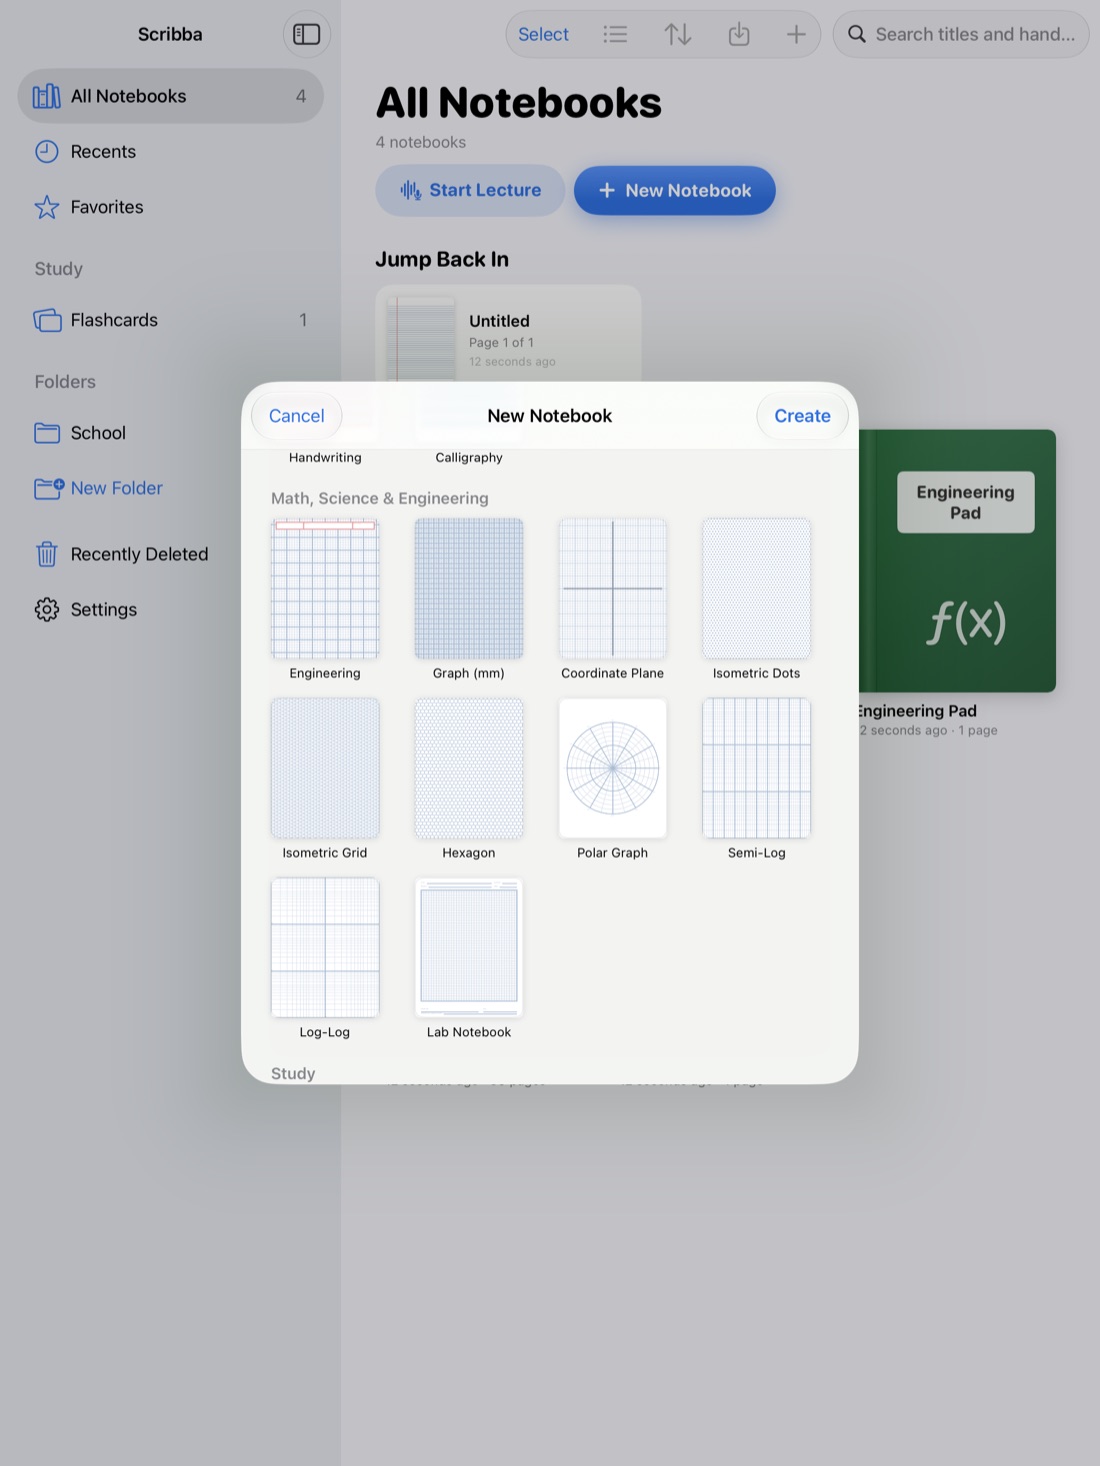
Scribba has both. Grid sits in the Essentials section of the paper picker. Graph (mm) is in the Math, Science & Engineering section: a millimeter grid with bolder lines every 5 mm and every centimeter, running edge to edge so the grid fills the whole page. The same section has coordinate plane, polar, semi-log and log-log papers for more specialized graphs.
A few ways to set it up:
- Change one page at a time. Paper type and color are set per page from the page sidebar, so a lecture page can stay ruled while the next one becomes graph paper for a lab plot.
- Go landscape for wide graphs. Orientation and page size (US Letter, A4, A5, iPad, Square or Widescreen) are chosen per notebook when you create it. Landscape suits time series that run long.
- Snap straight lines. Hold the Apple Pencil still at the end of a stroke and it snaps into a straight line. That's handy for axes and best-fit lines. There's also a ruler for lines you want to place by hand.
- Label small. The Zoom Window lets you write big in a magnified strip while the writing lands small and neat on the page, which helps when axis labels need to fit between bold lines.
- Turn it in. Export the notebook or selected pages as a PDF for a lab report or homework submission.
For a full setup for these classes, see math and chemistry notes on iPad and engineering notes on iPad.
Frequently asked questions
Should I use grid or graph paper for math homework?
Use a plain grid for most algebra and calculus work, since it keeps steps aligned without extra lines. Switch to graph paper when the problem asks you to plot or measure.
Can Scribba plot my data or draw the graph for me?
No. Scribba doesn't do math, recognize equations or generate graphs. It gives you the paper and tools to draw the graph by hand, which is also how most lab courses expect you to learn it.
Can I mix graph paper and ruled paper in one notebook?
Yes. You can change the paper of any page from the page sidebar, so one class notebook can hold ruled lecture pages and graph paper pages side by side.