 Scribba
Graphing calculators are great, but exams often ask you to sketch a graph without one, and "sketch" usually means more than a vague curve. Graders look for intercepts, asymptotes, the right shape and labeled points. The fastest way to get there is practice on paper that already has axes, so your time goes into the function, not into drawing a cross with a ruler.
This guide gives you a repeatable method for sketching functions, shading inequalities and showing transformations, then shows how to do it on Scribba's Coordinate Plane paper.
A method for sketching any function
Most functions you'll meet in algebra, precalculus and calculus can be sketched with the same checklist. Work through it in order and write each result on the page as you go.
- Domain. Where is the function defined? Watch for division by zero, square roots of negatives and logs of non-positive numbers.
- Intercepts. Set x = 0 to find the y-intercept. Set y = 0 and solve to find any x-intercepts.
- Asymptotes. Vertical asymptotes come from values that make a denominator zero. Horizontal or slant asymptotes come from the behavior as x grows large.
- Symmetry. If f(−x) = f(x), the graph mirrors across the y-axis. If f(−x) = −f(x), it has rotational symmetry about the origin. Either one halves your work.
- A short table of values. Pick a few x-values on each side of anything interesting, like an asymptote or a turning point.
- Plot and connect. Draw asymptotes first as dashed lines, plot your points, then draw a smooth curve that respects everything above.
- Label. Write the coordinates of intercepts and key points directly on the graph.
In calculus, add two steps after the table: where the derivative is zero (peaks and valleys) and where the second derivative changes sign (inflection points).
Graphing linear inequalities
Inequalities add one idea to graphing a line: which side is the answer.
- Graph the boundary line as if the inequality were an equals sign.
- Solid or dashed? Use a solid line for ≤ or ≥, since points on the line count. Use a dashed line for < or >.
- Pick a test point not on the line. The origin (0, 0) is easiest when the line doesn't pass through it.
- Shade the side that works. If the test point makes the inequality true, shade its side. If not, shade the other side.
For a system of inequalities, shade each one in a different color. The region where the colors overlap is the solution set. Light, see-through shading works best, so the overlap is easy to spot.
Tip: shade with neat parallel strokes rather than scribbles. Hatching in two directions for two inequalities makes the overlap obvious, even in a black and white PDF.
Showing transformations
Transformations are easier to understand when you see the parent function and the transformed one on the same axes.
- Draw the parent function first in one color, like y = x² or y = |x|.
- Track three or four key points, such as the vertex and one point on each side.
- Move those points by the rule, then sketch the new graph through them in a second color.
The rules for y = a·f(b(x − h)) + k are worth memorizing: h shifts right, k shifts up, a stretches vertically (and reflects across the x-axis if negative), and b stretches or compresses horizontally by a factor of 1/|b| (and reflects across the y-axis if negative). Doing the shifts last keeps you from mixing up the order.
The same approach works for geometry transformations of shapes. Plot the original triangle or quadrilateral, apply the rule to each vertex, and draw the image. Rotating 90° counterclockwise about the origin sends (x, y) to (−y, x). Reflecting across the y-axis sends (x, y) to (−x, y). Label the image vertices A′, B′, C′ so it's clear which point went where.
Coordinate plane paper in Scribba
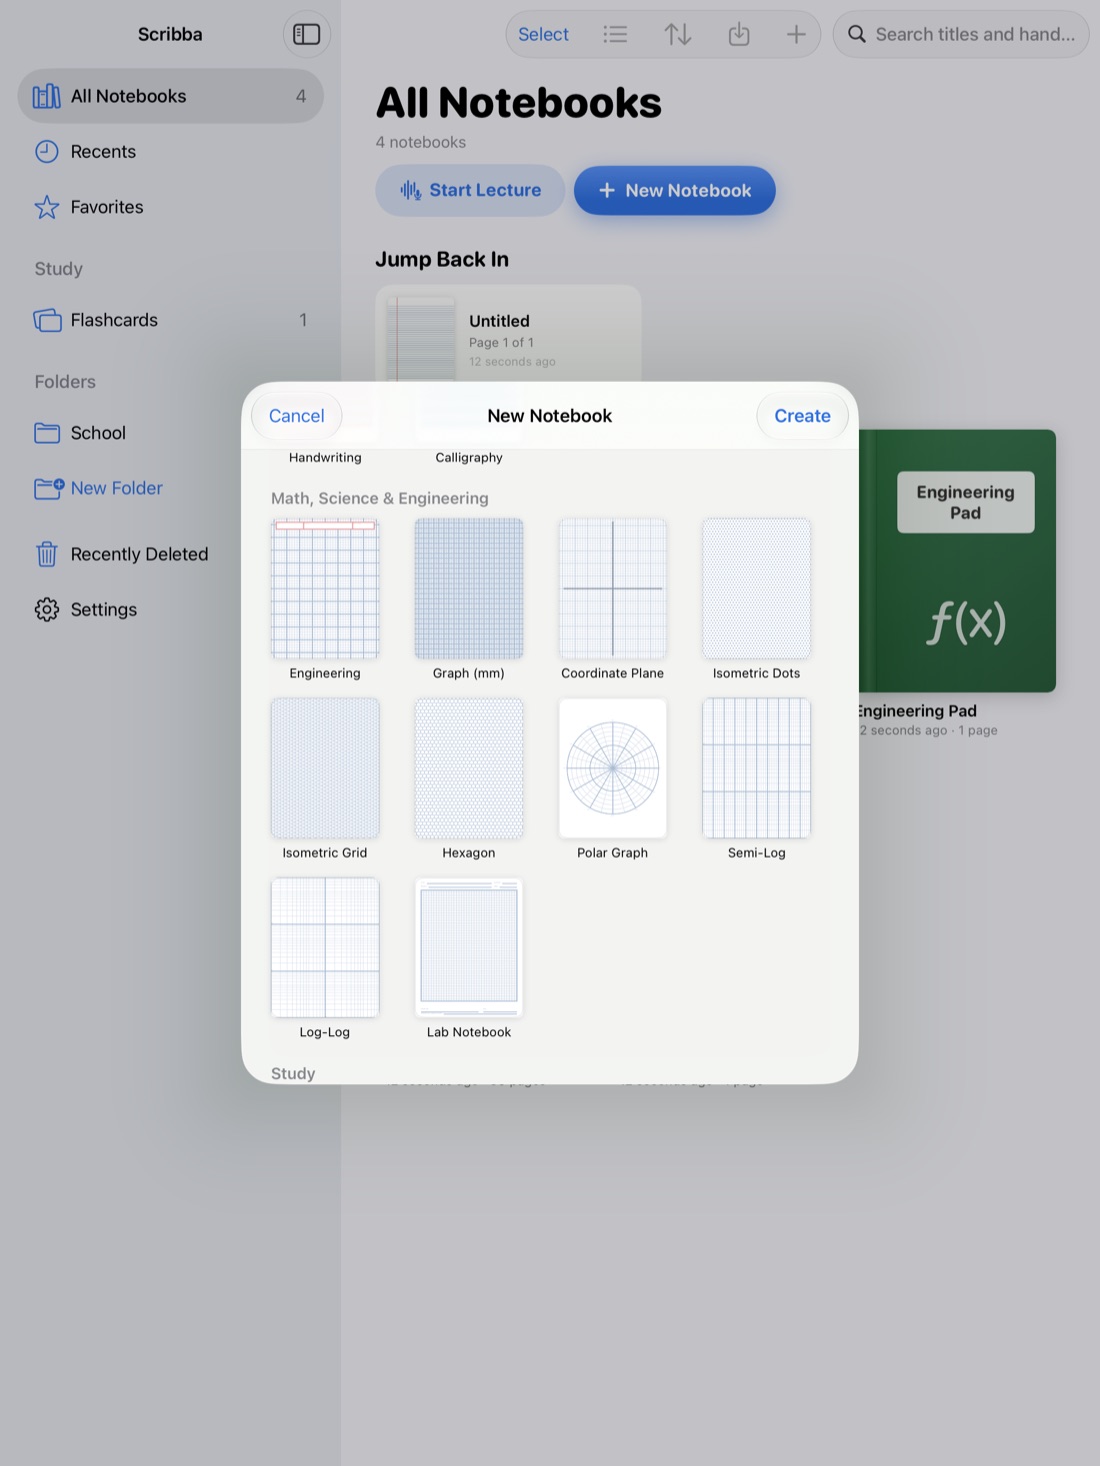
Scribba's Coordinate Plane paper is in the Math, Science & Engineering section of the paper picker. It has x and y axes through the center of the page, with arrows and tick labels, on a grid. Like Scribba's other graph papers, it runs edge to edge.
Ways to make it work for you:
- Switch a page when the lecture turns to graphing. Paper type is set per page from the page sidebar, so you don't need a separate notebook for graphs.
- Use one page per problem. Pull past the last page to add another. A clean set of axes for each function keeps your work readable.
- Snap lines, circles and ellipses. Hold the Apple Pencil still at the end of a stroke and it snaps into a straight line, circle or ellipse. That covers linear functions, boundary lines, asymptotes and conic sections.
- Color-code. Keep three saved colors on your pen: one for the parent function, one for the transformation and one for labels.
- Shade with the highlighter. Its strokes snap straight, which gives neat hatching for inequality regions.
- Write small labels clearly. The Zoom Window lets you write big in a magnified strip, and it lands small on the page, so point labels like (−2, 4) stay legible next to the curve.
If your function needs a scale the printed tick labels don't suit, write your own scale beside the axes, or use graph paper and draw axes where you want them.
Practice graphs as flash quizzes
Sketching is a skill, and skills come from retrieval, not rereading. Once you have a worked graph, hide it and try again from the equation alone.
In Scribba, drag study tape over the finished graph so only the equation shows. Sketch it on a fresh page, then tap the tape to peek and compare. This is active recall applied to graphing, and it shows you quickly which features you keep forgetting, like a missing asymptote. More on the tool in study tape on iPad.
Frequently asked questions
Can Scribba graph an equation for me?
No. Scribba doesn't recognize equations or do math. It gives you axes on the page and tools for drawing neatly, so you sketch the graph yourself.
What paper should I use for polar equations?
Use polar graph paper instead. Its rings and spokes match how polar coordinates work. See polar graph paper on iPad.
Do I need an Apple Pencil to graph?
It helps a lot for accuracy, but it isn't required. You can draw with your finger by turning on Settings › Draw with Finger.