 Scribba
Polar equations are where a lot of precalculus and calculus students first get lost. The curves are beautiful, roses, cardioids and spirals, but plotting them on square graph paper means converting every point to x and y first. Polar graph paper skips that step. Its rings measure distance from the center and its spokes measure angle, so you plot (r, θ) directly, the way the equation is written.
This guide covers how to plot polar equations by hand, the common curves worth recognizing, and other uses for the paper, from angle practice to 24-hour data. Then it shows how to set it up in Scribba.
How polar paper is read
A point in polar coordinates is (r, θ): go out a distance r from the center, at an angle θ measured counterclockwise from the positive x-axis.
- Spokes are lines of constant angle.
- Rings are circles of constant distance from the center.
Before you plot anything, decide what each ring is worth. If your largest r is 4, you might let every ring be 1 unit, or every other ring. Write the scale along one spoke so you don't forget.
Plotting a polar equation step by step
- Make a table of values. List θ in equal steps and compute r for each. Use radians or degrees, whichever your class uses, but stay consistent.
- Check for symmetry first. If replacing θ with −θ gives the same equation, the graph is symmetric across the x-axis, so you only need half the table. Equations with only cosine terms often behave this way.
- Handle negative r correctly. A negative r means you go out in the opposite direction, along the spoke 180° from θ. This trips up a lot of students, and it's the reason some rose curves have the petals they do.
- Plot each point where its spoke meets the right distance.
- Connect the points in order of θ with a smooth curve. Connecting them in order matters; jumping between points draws the wrong shape.
- Mark the maximum r and any zeros. Zeros of r are where the curve passes through the center.
Tip: if you're unsure where a curve goes between two points, compute one extra point halfway between them. One extra row in the table is faster than erasing a wrong curve.
Common polar curves to recognize
Recognizing the family before you plot tells you what shape to expect and catches mistakes early.
- Circles. r = a is a circle of radius a centered at the origin. r = 2a cos θ is a circle of radius a that passes through the origin.
- Cardioids. r = a(1 + cos θ) is a heart shape with its point at the origin.
- Limaçons. r = a + b cos θ. If a is smaller than b, the curve has an inner loop.
- Rose curves. r = a cos(nθ) or r = a sin(nθ). If n is odd, the rose has n petals; if n is even, it has 2n petals. Each petal reaches out to a distance of a.
- Spirals. r = aθ winds outward by the same distance on each turn.
When you finish a graph, write the family name next to it. It's a small habit that helps on exams, where recognizing the shape is often worth points by itself.
Angles, vectors and the unit circle
Polar paper is also a ready-made protractor.
- Unit circle practice. Pick one ring as radius 1 and label the special angles in both degrees and radians, along with their (cos θ, sin θ) values.
- Vectors. Draw a force or velocity vector from the center at its angle, with its length on the rings. Adding two vectors tip to tail on the same page shows the resultant's angle directly.
- Bearings. Navigation and surveying measure bearings clockwise from north, while math measures angles counterclockwise from the positive x-axis. Mark north at the top and practice converting between the two.
For physics uses like circular motion and fields, see physics notes on iPad.
Circular data
Some data is naturally circular, and plotting it around a center shows patterns a bar chart hides.
- 24-hour data. Spokes every 15° divide a circle into 24 parts, one per hour. Plot when you slept, studied or exercised each hour, with distance from the center showing amount.
- Directional data. Wind directions, compass readings or the direction an animal moves can be plotted as spikes along their angle, with length showing how often each happens.
- Antenna and microphone patterns. Engineering labs often measure signal strength at a series of angles. Polar paper is the standard way to plot them.
Polar graph paper in Scribba
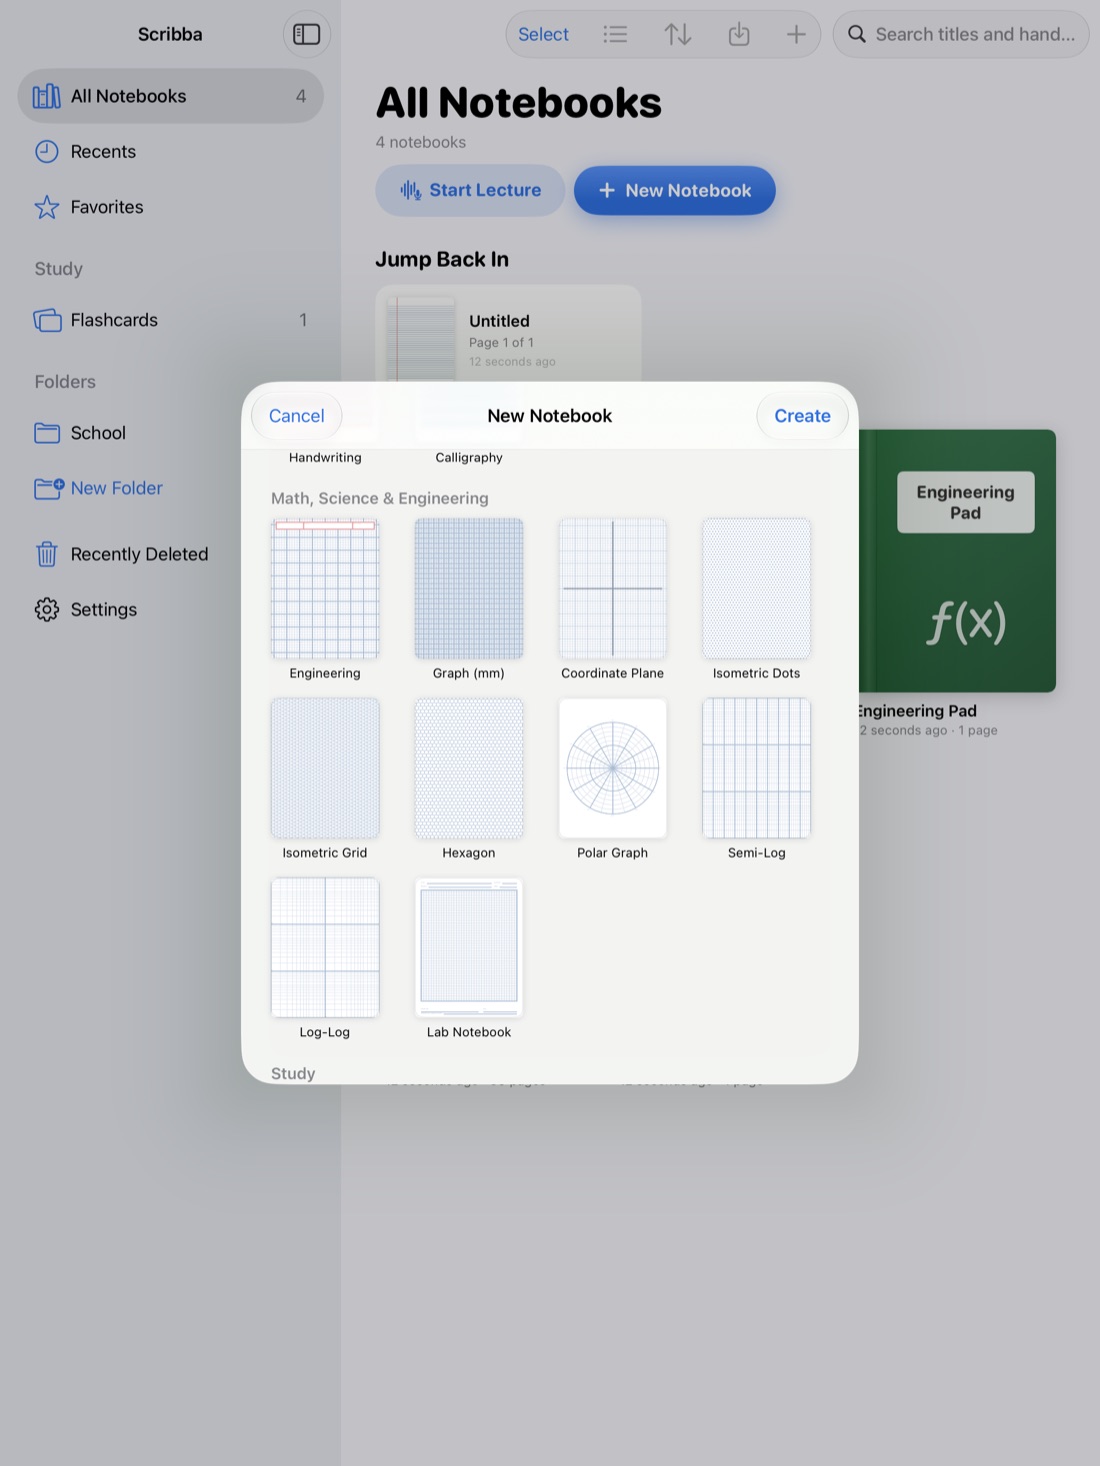
Scribba's Polar Graph paper has rings with spokes every 15 degrees. That spacing lands on all the special angles: 30°, 45°, 60° and 90°, or π/6, π/4, π/3 and π/2 in radians, since 15° is π/12. It's in the Math, Science & Engineering section of the paper picker, and you can switch any page to it from the page sidebar.
Ways to make it work well:
- Try the Square page size. Page size and orientation are chosen per notebook when you create it, and a square page suits a round graph.
- Snap circles and lines. Hold the Apple Pencil still at the end of a stroke and it snaps into a circle, ellipse or straight line. That's useful for circles like r = 2, vectors and the x and y axes.
- Color-code families. Graph r = cos θ, r = cos 2θ and r = cos 3θ on one page in three saved colors and compare them.
- Label small. The Zoom Window lets you write big in a magnified strip, and it lands small on the page, so angle and ring labels fit neatly.
- Quiz yourself on the unit circle. Write the values, then cover them with study tape and recall each one before tapping to peek. See study tape on iPad.
For graphs in x and y, use the coordinate plane paper instead.
Frequently asked questions
How many degrees apart are the spokes on Scribba's polar paper?
15 degrees, which is π/12 radians. That puts a spoke on every special angle you'll use in trig.
Can Scribba plot a polar equation for me?
No. Scribba doesn't recognize equations or do math. It gives you the polar grid and drawing tools, and you plot the curve by hand.
How do I plot a negative r value?
Go out the same distance in the opposite direction, along the spoke 180° away from your angle. For example, (−2, 30°) lands at the same spot as (2, 210°).