 Scribba
Some lectures are comparisons in disguise. Three theories of emotion. Five classes of blood pressure drugs. Four market structures. Six presidents and their foreign policies. If you take those notes as paragraphs or an outline, you end up flipping between pages to compare them. The charting method puts them side by side from the start.
What the charting method is
You take notes in a table:
- Rows are the things being compared: the theories, drugs, events or characters.
- Columns are the questions you ask about every one of them: who, when, how it works, an example, a weakness.
- Each cell holds a short fact, a few words at most.
Read across a row and you know everything about one item. Read down a column and you can compare all the items on one point. That second direction is what makes charting different from every other method: the comparison is built into the page.
When the charting method fits
Charting works when a lecture or reading covers several items that share the same categories:
- Psychology and sociology: theories, theorists, studies and their findings.
- Nursing and pharmacology: drug classes with mechanism, uses, side effects and nursing notes. See nursing school notes on iPad.
- History: events or leaders with dates, causes, key figures and outcomes.
- Literature: characters, their goals, conflicts and how they change.
- Biology and chemistry: organelles, hormones, reaction types, element groups.
It fits poorly when a lecture builds one long argument, or when you can't predict the categories. Charting needs you to know the columns before you fill them. If a class is unpredictable, take regular notes and build the chart afterward. That's still a strong review exercise.
A worked example
Your Intro Psychology lecture covers three theories of emotion. You know from the syllabus that's the topic, so you set up four columns: Theory, What comes first, Key claim and Example.
Here are the rows, in words:
- James-Lange. What comes first: the body's reaction. Key claim: emotion is how we experience our body's response. Example: you feel afraid because you notice you're trembling.
- Cannon-Bard. What comes first: neither, both happen at once. Key claim: the body's arousal and the feeling of emotion happen together and independently. Example: trembling and fear arrive at the same moment.
- Schachter-Singer (two-factor). What comes first: arousal, then a label. Key claim: emotion is physical arousal plus how we interpret it. Example: a racing heart at a party feels like excitement; the same racing heart in a dark parking lot feels like fear.
Now read down the "What comes first" column. Body first, both at once, arousal plus a label. In three short cells you have the exact contrast an exam question will ask about.
How to set up a chart for class
- Find the categories before class. The syllabus, posted slides or the assigned reading usually tell you what's being compared and what matters about each item.
- Turn the page sideways. Landscape gives you room for more columns.
- Size the columns to the content. Keep the first column narrow for item names. Make the widest column the one that needs the most words, usually "how it works" or "key claim."
- Leave extra rows, and a strip of blank space under the chart for anything that doesn't fit a cell.
- Fill cells in a few words. If you miss something, put a question mark in the cell and keep going. An empty cell after class is a clear to-do.
- Add a column after class if you need it. "How it differs from the others" is often the most useful column, and it's easier to write once the chart is full.
Tip: if the professor adds a category halfway through, don't redraw. Add it as a new column on the right, or as a line under each row, and tidy up later.
How to study from a chart
A chart is one of the easiest kinds of notes to quiz yourself from:
- Cover a column. Hide "Key claim," read each theory's name, and say the claim out loud. Then check.
- Cover a row. Hide everything about one item and recall all of it.
- Answer compare-and-contrast questions by reading straight down a column. That's the structure most of those essay answers need.
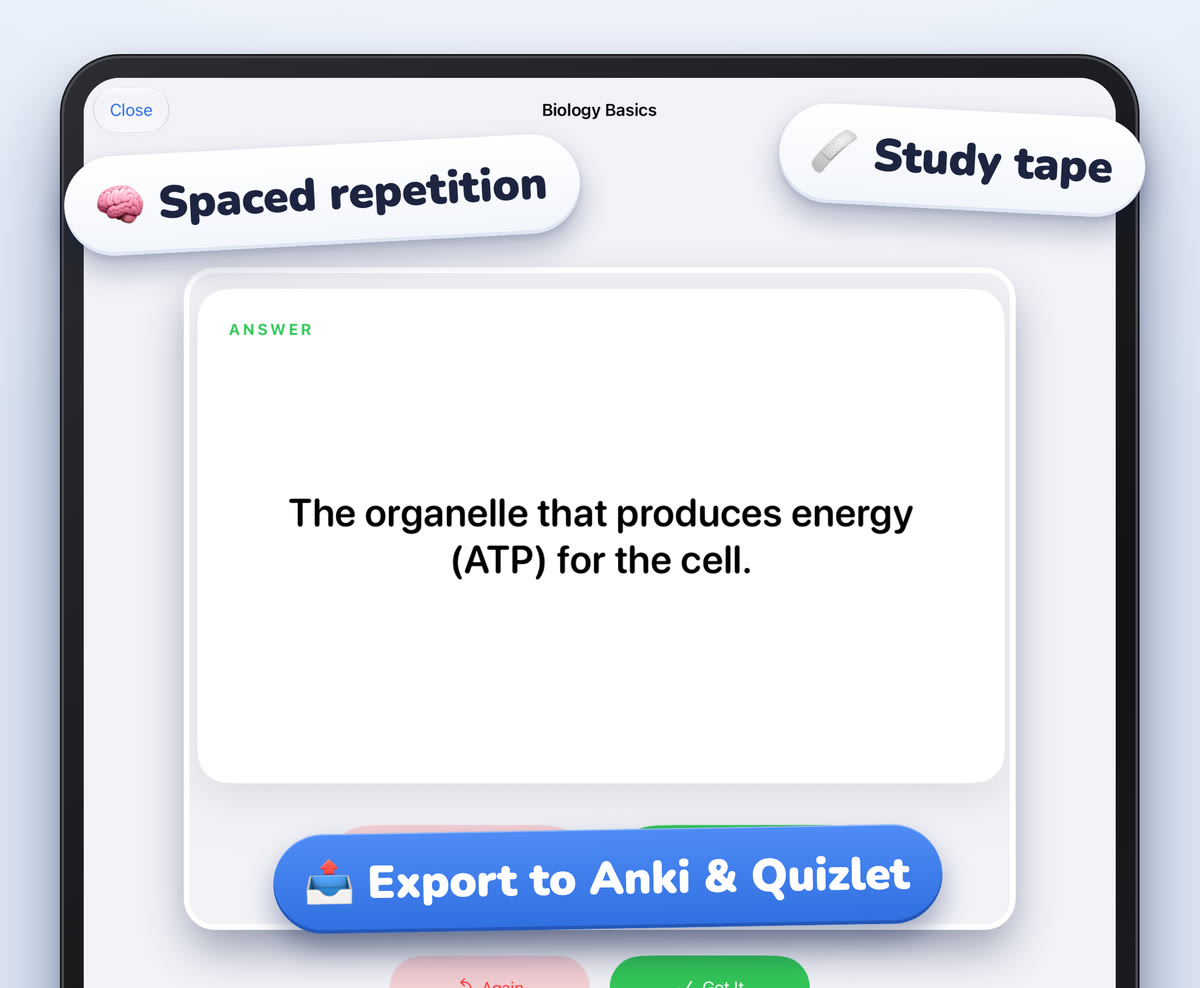
- Turn rows into flashcards. One row, one card: the item on the front, the key facts on the back.
Testing yourself like this is active recall, which helps you remember more than rereading does. Our guide to how to make good flashcards covers turning facts into questions.
Common mistakes
- Too many columns. Four or five is plenty for handwriting. More than that and every cell gets too small to read.
- Sentences in cells. If a cell needs a sentence, the column is probably two columns.
- Forcing a chart onto the wrong material. If items don't share categories, a chart fills up with blank cells. Use an outline instead.
- Cramped cells. Give each row more height than you think you need. Professors always add one more detail.
- Only reading it. A chart looks complete and clear, which makes it easy to skim. Cover parts of it and test yourself.
Charts on iPad with Scribba
Drawing a neat table by hand is the slow part of charting on paper. On an iPad it's quicker.
Choose paper with lines to follow. In Scribba, Grid paper or Graph (mm) paper gives you lines to trace for columns and rows. Make a landscape notebook for charts, since orientation is chosen per notebook when you create it. To use grid paper for one page in a regular class notebook, change that page's paper from the page sidebar.
Draw straight lines fast. Hold the Apple Pencil still at the end of a stroke and it snaps into a straight line. Draw a rough rectangle for the outer frame, pause, and it becomes a clean one. The ruler helps with long column lines.
Write neatly in small cells. The Zoom Window lets you write big in a magnified strip, and your writing lands small and neat on the page. Text boxes work well for typed column headers.
Use Vocabulary paper for two-column charts. If your chart is really "term and what it means," Scribba's Vocabulary paper already has a two-column table, TERM and DEFINITION / EXAMPLE. Scribba reads the handwriting on a Vocabulary page and turns each row into a flashcard. You review the cards and fix any misread words first, then study them with spaced repetition. This doesn't need Apple Intelligence. More in flashcards from handwritten notes.
Cover columns with study tape. Drag study tape over a column, quiz yourself on each row, and tap to peek.
Frequently asked questions
How many columns should a note-taking chart have?
Usually three to five, including the column for item names. If you need more, split the chart into two smaller ones.
Can I make a chart from notes I already took?
Yes, and it's a great review. Go through your notes, pick the items being compared, decide the columns, and fill the cells from memory before checking your notes.
Is charting good for exam prep?
Very. Compare-and-contrast questions are common on exams, and a chart lays out exactly those comparisons. Covering a column and recalling it is a fast way to practice.