 Scribba
Freehand lines on glass wobble. Most of the time that doesn't matter. But a table with crooked rows is hard to scan, and a graph with a leaning axis is hard to trust when you're reading values off it the night before an exam.
A ruler fixes that. This guide covers when a ruler is worth the extra second, and how to use one for the four things students draw most: tables, underlines, diagrams and graphs.
Three ways to get a straight line
Before you reach for the ruler, know your options. The fastest one depends on the job.
- Snap it. In Scribba, draw a line and hold the Pencil still at the end. It snaps straight. The same works for arrows, rectangles, triangles and other shapes, and the Shape tool snaps every stroke. This is the quickest way to get one clean line anywhere.
- Let the paper do it. Grid, graph and dot grid papers give you lines to trace or dots to connect. A table on grid paper often needs no ruler at all.
- Use the ruler. Reach for it when a line has to land in an exact place, line up with something else on the page, or match other lines exactly: table borders, long axes, a set of underlines that should all end at the same point.
For more on snapping, see how to draw straight lines and shapes on iPad.
Using the ruler in Scribba
- Tap the + menu in the notebook's top bar and choose the ruler.
- Move it into place where you want the line.
- Draw along its edge with your pen.
- Put it away when you're done, so it doesn't get in the way of your writing.
Draw with a light, steady stroke. There's no need to press hard against the edge the way you would with a real ruler.
Tip: if you're drawing several lines in a row, like all the dividers of a table, draw them one after another while the ruler is out instead of switching back and forth.
Drawing tables
Tables are one of the most useful things you can draw in notes. A compare-and-contrast table, like mitosis vs meiosis or two economic theories side by side, often teaches more than a page of paragraphs, because the gaps jump out at you.
A few habits make hand-drawn tables much easier:
- Plan before you draw. Count your columns and decide which one needs the most room. The column with full sentences should be the widest; labels and numbers can be narrow.
- Draw the outside border first, then the column dividers, then the rows. That way every line has something to meet.
- Use the paper's rows. On ruled paper, half the table is already there. The printed lines are your rows, so you only need the ruler for the vertical dividers.
- Add a header row and underline it, so the table reads at a glance.
- Leave a spare row or column. It's much easier than squeezing in an item the professor adds at the end.
Some tables are common enough that Scribba has paper for them. The Vocabulary paper is a two-column table of TERM and DEFINITION / EXAMPLE, and you can turn its rows into flashcards (see flashcards from handwritten notes). The Class Schedule paper is a weekday-by-hour grid. If a table you draw every week already exists as paper, use the paper and save the ruler for everything else.
Underlines and dividers
Lines also give a page structure:
- Underline headings so each section of the lecture is easy to find when you skim.
- Draw a full-width divider at the end of each topic or each class. It marks where one idea stops and the next starts.
- Double-underline final answers in problem sets, so you can find them without reading every step.
For a short underline, a snapped line is faster than the ruler. Save the ruler for long dividers and for lines that should match each other. To emphasize a word rather than structure the page, try the highlighter instead: in Scribba its strokes snap straight, so a quick swipe stays on the line.
Diagrams
In science and engineering, some lines have to be right. The surface of an incline, the edge of a beam, a wire in a circuit or the side of a beaker all read better when they're straight and meet where they should.
- Draw the main structure with the ruler, like the ground line or the frame of a circuit.
- Snap the shapes, like blocks, arrows and circles, by holding the Pencil still at the end of the stroke.
- Label last, after the lines are in place, so labels don't end up underneath them.
Physics notes on iPad and math and chemistry notes on iPad cover diagrams for those classes in more detail.
Graphs
A hand-drawn graph only works if the axes are straight and the scale is even. A good routine:
- Draw the axes first, with the ruler, from a corner that leaves room for labels.
- Label each axis with what it measures and its units.
- Choose a scale that uses most of the space, and mark ticks at even steps. On grid paper, count squares instead of guessing.
- Plot your points, then draw any trend line. For a straight line of best fit, aim for a line with roughly as many points above it as below. A snapped line is the quickest way to draw it.
- Draw curves freehand. Supply curves, growth curves and decay curves bend, and a smooth freehand curve on a grid looks better than a chain of short ruled segments.
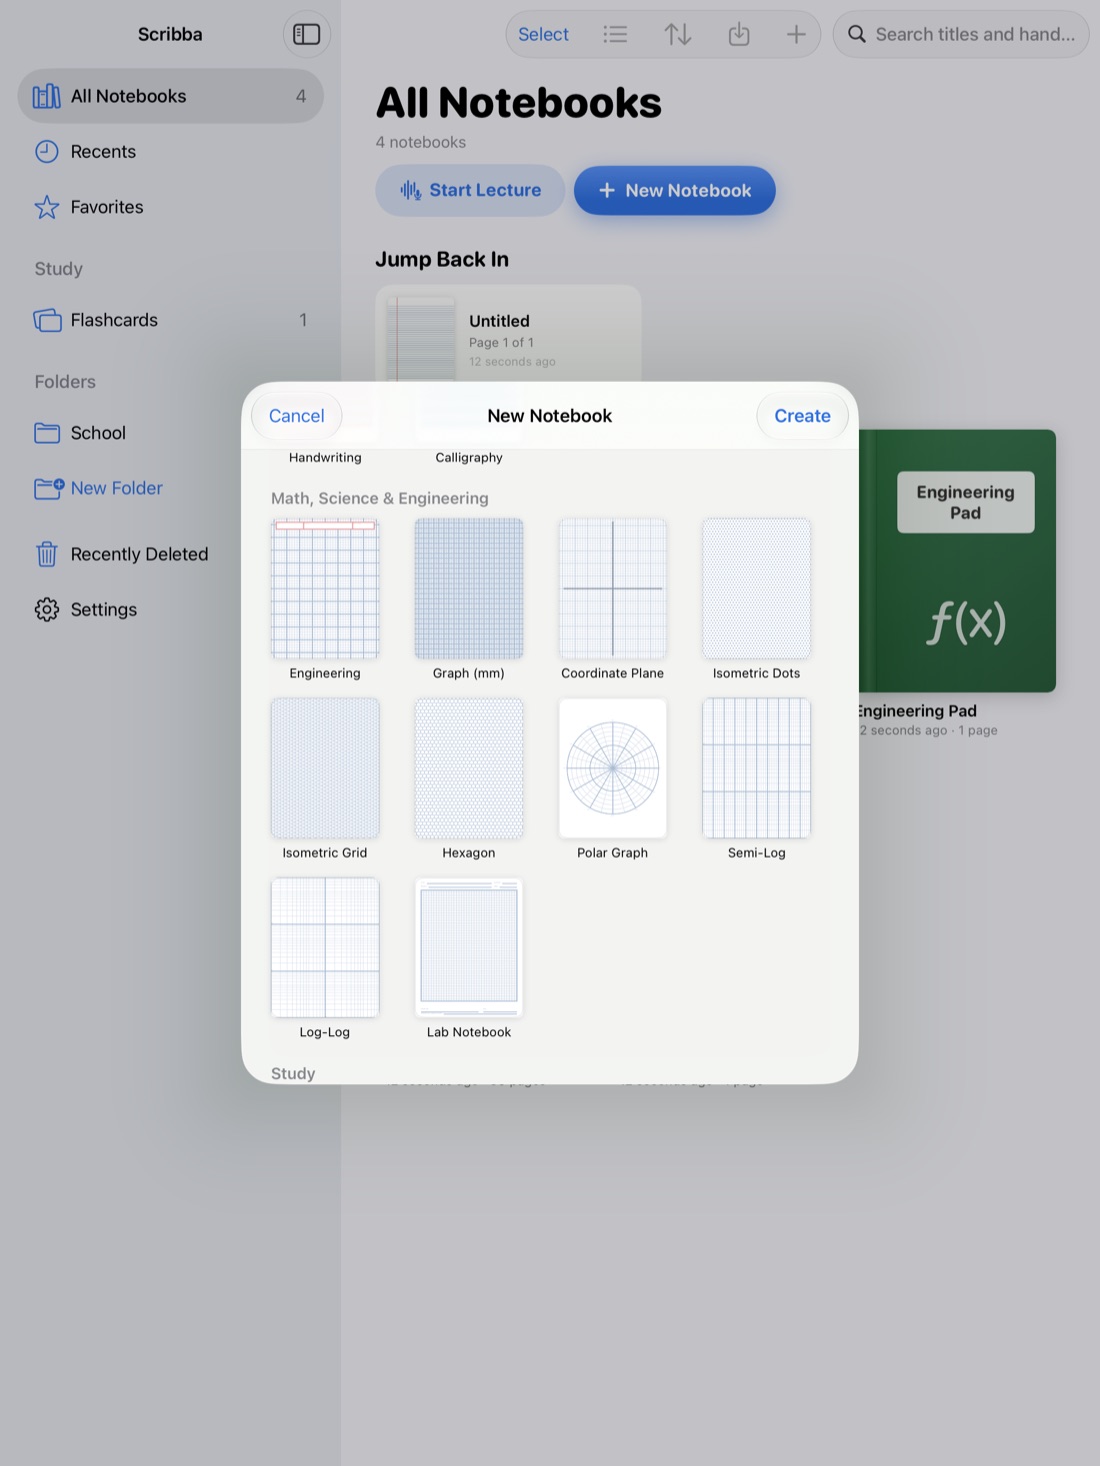
The right paper saves steps. Scribba's Coordinate Plane paper already has x and y axes through the center with arrows and tick labels. Graph (mm) has a millimeter grid that's bolder every 5 mm and every centimeter, good for lab data. Semi-Log and Log-Log papers handle data that grows or shrinks by factors rather than steps. See graph paper on iPad for more.
When not to bother
In a fast lecture, the ruler can cost you the next sentence. Sketch the table or graph freehand, or snap the lines, and keep listening. You can redraw anything important with the ruler when you review the notes later.
Frequently asked questions
Where is the ruler in Scribba?
Tap the + menu in the notebook's top bar and choose the ruler. The same menu has text boxes, sticky notes, the Zoom Window and bookmarks.
Do I need the ruler to draw a straight line?
No. In Scribba, draw a line and hold the Pencil still at the end, and it snaps straight. The ruler is for lines that have to land in an exact spot or match other lines.
What paper is best for drawing graphs?
Coordinate Plane paper if you want axes already drawn, Graph (mm) for plotting data precisely, and Semi-Log or Log-Log for data on a log scale.